


How to measure employee performance (using quality metrics)
)
Chances are you’ll use KPIs or some kind of performance metrics, which you might also use to identify training opportunities, monitor improvement, decide who to hire, who to let go, who to reward, and who to promote. However, it turns out some of the most commonly used performance metrics are based on dubious measurements. In this post, we’re not only going to break down the hidden factors that influence employee performance and share some quality metrics you can use, but we’ll also show you how to calculate the cost of your performance process, to make sure you’re getting an ROI.
Calculating the cost of performance management
Managing (and measuring) performance takes TIME.
If you were to do the math, the time cost of all of your performance management interactions across every employee might come as a shock – there’s performance evaluations and annual reviews, training programs, setting goals, and oh so much paperwork. And if you account for your employee’s time too, and team members if you do things like 360 degree reviews, it might start to get a little overwhelming.
If your end goal is to increase organizational performance, then as long as the time costs of improving employee performance are offset by the value added in terms of output or profit, then you’re ahead (this is why quality metrics to measure employee performance are vital). Before your can determine if your performance process is delivering ROI, first you need to calculate the cost of your organization’s performance process and your break even point.
Step 1. Calculate the total cost of your performance process for all employees. In this step, you’ll figure out what all of the interactions in your performance process are costing your organization in terms of the employee’s time, supervisor’s time, and HR’s time. You can calculate these costs here using our free performance management time-cost calculator.
Step 2. Calculate your break-even point.
This quick calculation could help you to understand how much of a performance improvement your performance process needs to bring your business to break-even. Compare your “total cost for all employees” in Step 1 with an estimated cost of annual wages in your business. Example:
For an organization with 200 staff and average salary of $70,000:
Estimated cost of annual wages: 200 x 70,000 = $14,000,000
Performance process “total cost for all employees” = $140,000 annually
Break even = Estimated cost of annual wages / Performance total cost for all employees
$14,000,000/$140,000 = 1%
Therefore, the performance process in this business needs to increase overall organization performance by 1% to break-even in time-cost.
Although 1% sounds achievable, the statistics and commentary surrounding performance processes tell a different story. Did you know? intelliHR can automatically calculate the time and cost of an employee’s training and development. Check out this and our other HR analytics reports.
RELATED: The ultimate guide to generating ROI in HR
How effective are organizational performance processes?
With all of the time put into performance management (which now we know can equal a lot of money), you might be wondering how effective performance processes actually are. Let’s take a look at some stats.
30% of performance reviews lead to decreased employee performance and more than half fail to identify high performers – Empxtrack.
58% of companies believe their performance reviews aren’t an efficient use of time – Talent Management 360.
Only 27% of workers strongly agree that the feedback they receive helps them do their work better – Gallup.
Almost half of HR leaders think that their performance reviews aren’t an accurate representation of employee performance – SHRM.
If these stats are indeed an accurate depiction of the effectiveness of performance processes for both employees and managers, breaking even with your time investment could be more difficult than expected.
Some of the better-known ways to lift performance process effectiveness include establishing continuous feedback processes and setting smart goals. However, below, we’ll explore another approach – understanding metrics and their connection to employee performance**.**
RELATED: The death of the annual performance review
Employee performance metrics and their connection to performance process effectiveness
Performance processes should be based on metrics of some kind.
It’s important to be aware that the particular performance metrics you choose can influence both performance, the quality of feedback given, as well as the overall process. For example, imagine placing an employee on a performance improvement plan when the metrics that lead to the PIP were not representative of the employee’s performance at all… That might not end well!
Alternatively, imagine praising an employee for all their hard work throughout the quarter when the environment was so uncertain that luck played a major role in their achievements.
To ensure you’re choosing and using the right metrics, let’s break down the elements that contribute to output performance to see what we can learn about performance metrics.
How to measure employee performance
Here’s a basic equation to measure employee performance: 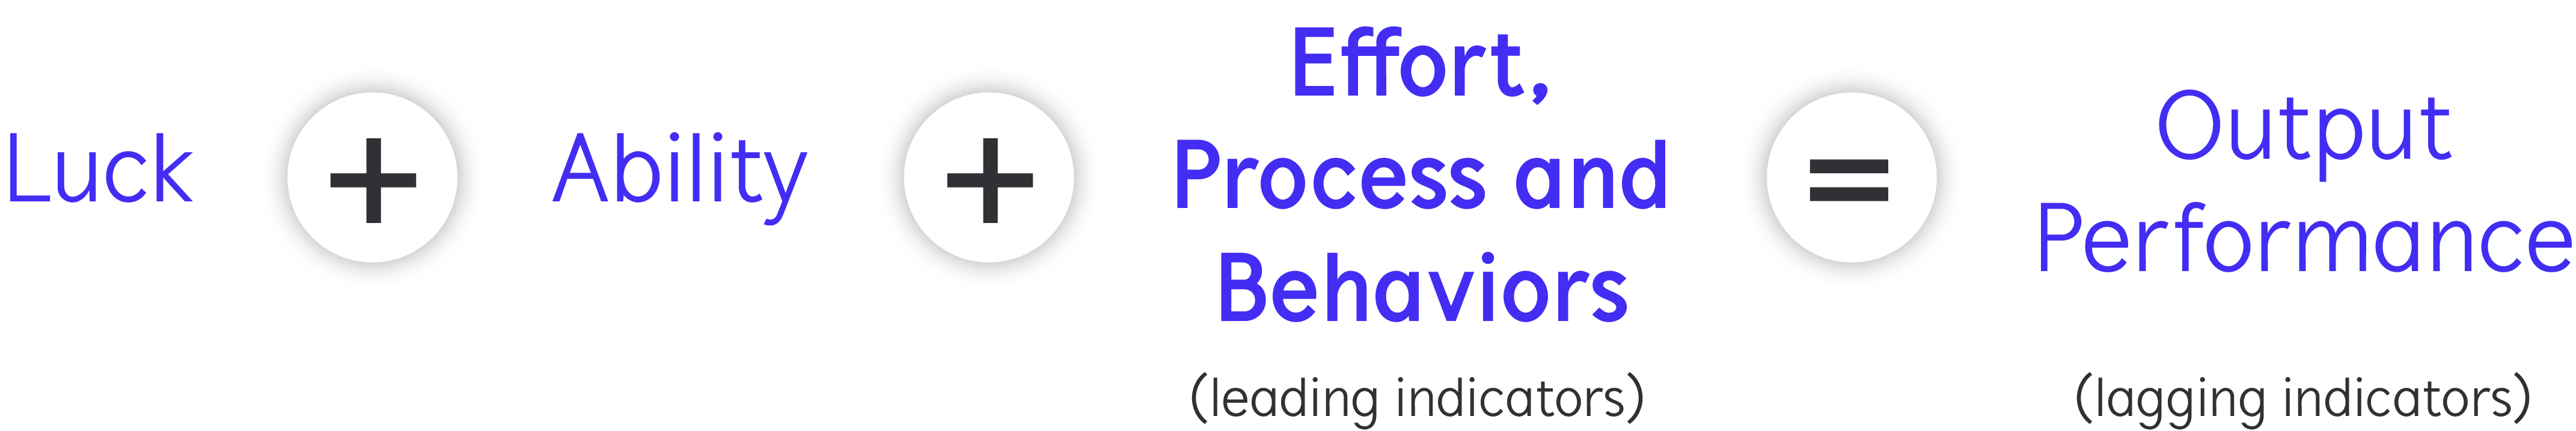
Output performance (lagging indicators)
The most commonly used performance metrics are based on outputs, which come at the end of the above equation. Common examples include:
$ revenue generated
Software projects completed
Budget variance
% of overdue tasks
Incidents reported
Output metrics like these are so widely used because they are accurate and simple to quantify. Many of us are also subject to outcome biases, meaning that we underplay the role of luck/chance in the process and afford too much explanatory power to outcomes in measuring performance.
However, performance metrics based on outputs alone must be treated with caution. Outputs are lagging indicators
While there’s nothing wrong with including outputs in your mix of performance metrics, they are lagging indicators. Lagging indicators follow as a result of actions, often with a delay.
Focusing solely on lagging indicators can limit your understanding of the elements that improve future outcomes such as effort, process and behaviors (leading indicators).
This an also have the unintended effect of allowing and reinforcing unfavorable efforts, processes or behaviors that achieve outputs, but cause long-term harm.
For example, if you’re rewarding salespeople solely based on a “revenue generated” metric and they behave in a pushy way to get the sale over the line, although this helps them reach their KPI, it can also be detrimental to the company reputation which might impact the number of enquiries received over the long term.

Luck
In the above equation, luck is the unforeseen or hidden error that is a randomly positive, negative, or neutral force. Luck is essentially the noise – the part of the equation that we can’t account for.
The impact of luck can be different for every task, job and industry. If we know a lot about the circumstances of the performance environment – like for a bricklayer, who will lay about the same number of bricks every day – then luck will play less of a role. If we don’t know a lot about the performance environment and it varies a lot, luck will naturally play a much larger role.
The graphic below shows the impact of luck on our performance metrics. Because we can’t really account for luck, it’s important to strengthen the metrics we use to understand ability, effort, processes and behaviors. 
Luck and regression to the mean
A key tip to remember about performance is that even though luck will play a role, an employee’s output performance will typically regress to their mean (average) level of performance over time.
This means that measuring employee performance using performance metrics from longer time frames helps to reduce luck’s impact. Therefore, for important decisions such as promotions, rewards, performance plans and terminations, it can be a good idea to use a longer time frame for the metrics.
Let’s take a look at an example of two employees’ performance over four quarters:
Employee 1 output performance
Employee 2 output performance
Quarter 1 achievement
60
40
Quarter 2 achievement
40
70
Quarter 3 achievement
40
80
Quarter 4 achievement
60
60
Mean achievement
52.5
62.5
From this example, we can see that basing important decisions on quarter 1 achievement would have been flawed. Employee 1 seemed like they would be the best performer when Employee 2 was scoring ⅓ lower. By using a longer time-frame, we can see that employee 2 has performed better by almost 20%.
Looking at these results, it could be useful for the organization to explore the luck, ability and effort, processes and behaviors of Employee 2 that led to this outcome. Going forward, metrics for these employees could be based more heavily on the leading indicators that precede the desired outcomes – a concept discussed in more detail below.
Ability
Natural (innate) vs acquired ability
For most tasks, some level of natural ability influences output performance.
However, defining ability as innate has the downside of creating performance processes that are only applicable to those with the innate ability. This approach represents a fixed mindset, i.e. believing that ability is a fixed gift that doesn’t change. This can be a dangerous way to treat ability, and companies with this sort of mindset tend to report more cheating and deception among employees (which is not ideal for anyone!).
Viewing ability as acquired, on the other hand, implies that any employee can become an excellent performer through hard work, good processes and input from others. This is a growth mindset.
Defining ability as acquired helps employees to feel more empowered and committed. It opens up the possibility of using metrics that lead to high performance, based on effort, processes and behaviors, which works well for most roles and tasks.
In any case, when an employee possesses a higher level of ability (natural or acquired), it creates an opportunity to set higher metrics for their performance in this dimension. This can help them to grow and remain engaged as they achieve stretch goals.
Effort process and behaviors (leading indicators)
Leading indicators are inputs that reliably predict future desirable output performance. Examples of leading indicators and how they relate to lagging indicators include:
Leading indicator (input) =
Lagging indicator (output)
% hard hats worn at a building site
Number of injuries at the building site
% ball possession in soccer
Games won
Number of account management calls
Customer retention %
Lines of software code written
Number of features added to software product
When an employee’s effort, behaviors and processes can be measured in the form of leading indicators shown above, it makes sense to shift your metrics to include them. That way you will have more consistent metrics of “actual” performance.
The key challenge for creating metrics that measure effort, process and behaviors is their intangible nature. It’s near impossible to get a perfect measurement.
There are two main categories of measurements for these elements:
Leading drivers – quantitative activity metrics (discussed above)
Qualitative/subjective metrics
Qualitative and subjective measurements:
Often there is more to performance than activities that can be quantitatively measured. Qualitative and subjective measurements can shed further light on employee performance, but they are limited by a range of human factors. Example of qualitative/subjective metric: 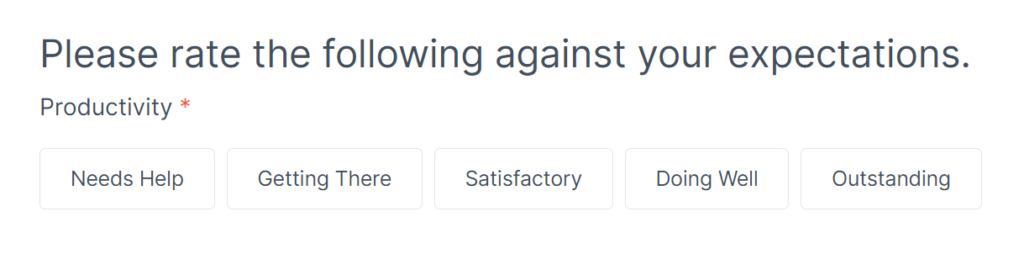
A key limitation is the Idiosyncratic rater effect, which refers to the unreliability of humans rating others. The data on this shows that on average, over 60% of a rating by one human upon another is a reflection of the unique tendencies of the rater. Rater’s idiosyncrasies influence the rating, e.g. how they define the rating, where they place themselves on the scale and so on.
Here are some ideas for reducing human bias and limitations:
Collect feedback from all angles – peer feedback, direct report feedback, customer feedback and ensure these signals are obtained independently.
Reframe the questions to ask raters to rate their own behavior rather than the ratee’s e.g. “Given what I know of this person’s performance, and if it were my money, I would award this person the highest possible compensation increase and bonus.” (Source)
Be aware of cognitive biases:
Recency bias (weighing recent events more heavily).
Confirmation bias – try to avoid searching for or interpreting information in a way that confirms your prior beliefs or hypotheses.
Performance metrics in high-certainty/low luck environments
In a high-certainty performance environment, the employee has more control over the exact performance outcomes. In such an environment, luck will play less of a role.
Examples of high certainty performance environments:
Bricklaying – fairly stable task and requirements; however there is still some luck involved e.g. weather.
Factory worker – typically a tightly controlled environment where expected input = output.
In these environments, the importance of leading indicators and qualitative/subjective measurements is lower, because the impact of luck is smaller. Therefore, in these scenarios, it is okay to focus metrics more toward the lagging indicators/outputs such as bricks laid or pieces produced.
Performance metrics in low certainty/high luck environments
In a low certainty performance environment, the employee has less control over the exact performance outcomes. In these environments, luck plays a larger role.
Examples of low certainty performance environments:
Solution sales – a huge number of external factors outside of the employee’s control can influence output performance (e.g. the prospects and their industry, economic conditions, time of year).
Stock traders – “There is general agreement among researchers that nearly all stock pickers, whether they know it or not – and few of them do – are playing a game of chance.” – Daniel Kahneman, Thinking Fast and Slow
In uncertain environments, the emphasis on leading indicators is higher because the impact of luck is higher. Therefore, you’ll need to identify the inputs (often effort, processes and behaviors) that tend to lead to desirable outputs. The below graphic might help with understanding this idea. 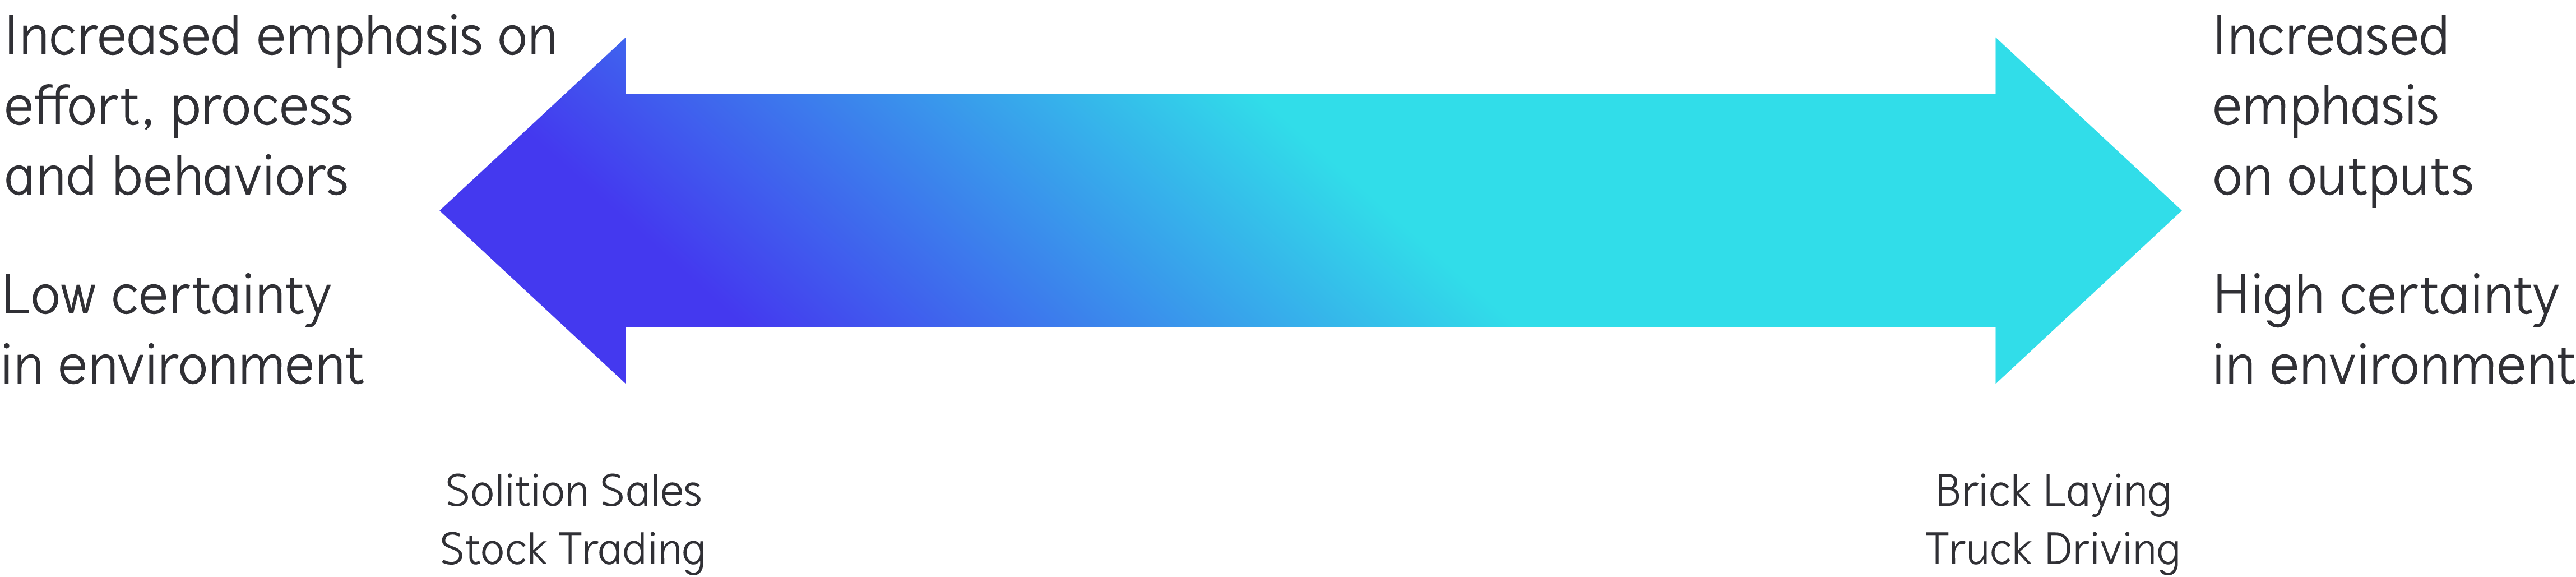
Measuring employee performance: Putting it all together
Performance processes can have a surprising time cost for a business, yet studies show that performance processes are often ineffective, with one of the reasons being the use of poor metrics.
This is because we often give too much weight to output performance metrics and don’t account for the impact of luck, which often plays a much larger than expected role.
Using metrics to measure employee performance that account for the presence of luck can unlock more opportunities to understand “actual” performance that will lead to higher organizational performance. And using performance management software or tools will help you to keep on top of your processes.
Key takeaways:
Output metrics are most useful in high certainty/low luck environments.
Leading indicators and qualitative/subjective measurements are more useful in low certainty/high luck environments.
Include leading indicators (where possible) in your performance metrics. Focus on these and organizational results will follow.
Base your important decisions on performance metrics that cover a wider performance timeframe.
Thinking of ability as innate can be harmful. In most cases, it is useful to think of ability as something that can be acquired and learnt.
Qualitative ratings can be limited by a range of human factors, be aware of and plan for them.
Read next: